
Weekly Recap Research 15 - 21 Dec 2025
Week of December 15 - 21, 2022
%20(1)_progressive.jpg)
Weekly Recap Research
Weak on-chain signal CryptoQuant looks at Bitcoin beginning to enter bear market cycle

CryptoQuant estimates that Bitcoin has entered a bearish market, citing on-chain data that reflects a significant slowdown in market demand since the beginning of October. The growth rate of new demand has continued to decline, while the selling force and pressure from the derivatives market has clearly increased. The overview reflects that the previous uptrend has used buying power. It's almost gone, and the market is lacking enough new drivers to support the price.
The report also states that the market structure is beginning to look consistent with past bearish market periods: weakening investor sentiment levels, shrinking Long opening volumes, and prices breaking below long-term averages over several periods. These signs indicate that the market is in a phase of structural adjustment, rather than just a short-term price lull.
CryptoQuant estimates that if demand fails to recover in the near term, the price of Bitcoin is at risk of falling to around $70,000, and if buying forces remain weak, a deeper adjustment could be seen. The overall picture sees the market entering a period of strong accumulation and screening of investors, a typical feature of bear market cycles, rather than a sign of the end of the crypto cycle in Long term
Uniswap Moves Close to Activating Fee Switch After UNI Holders Vote Over 99% Agree

Uniswap's “fee switch” activation proposal is nearing implementation following a clear community vote in favor, with over 99% of eligible voters agreeing to the concept, reflecting the demand of UNI token holders who want to see the protocol's revenue structure concretely linked to the token itself, rather than just acting as a side tool. governance only
If the proposal passes final approval, the fee switch system will pave the way for some of the fees from using Uniswap to be allocated according to the established mechanism, instead of being passed on to the liquidity provider unilaterally. This change is seen as a major turning point in the UNI economic structure, as it makes the value of the token more directly tied to the growth and monetization of the protocol.
Overall, the overwhelming support from the community reflects the direction of the DeFi system in the next phase, where token holders are starting to expect a more explicit role in value and revenue, rather than just token voting rights, and if Uniswap can successfully execute on its plans, it is likely to become an important case study for other DeFi protocols to restructure. Kenomics followed in the future
Top Net flows
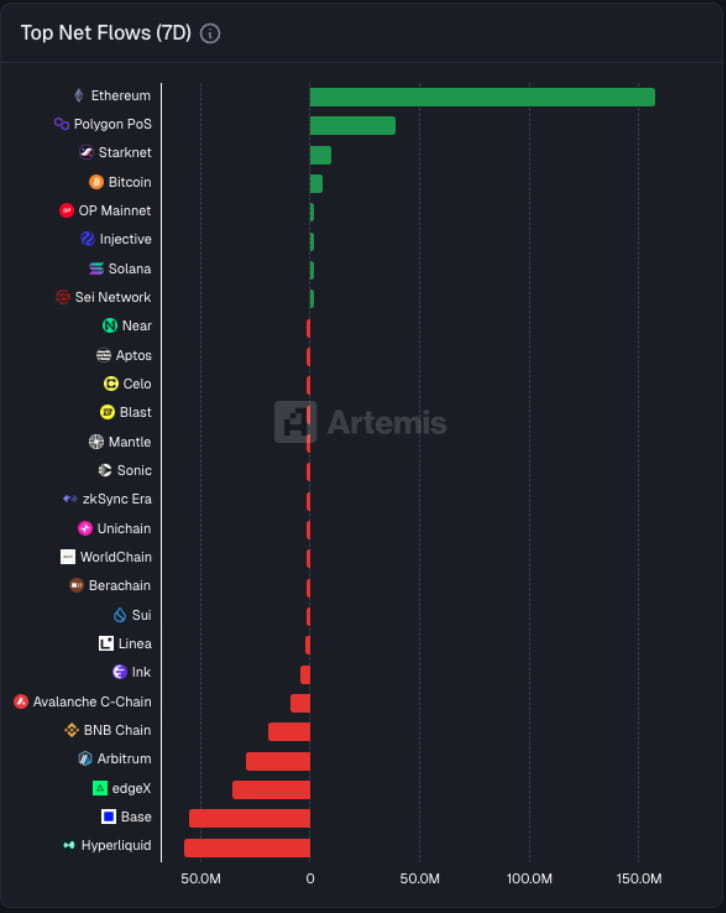
The Top Net Flows (7D) data reflects the movement of funds on blockchains that clearly differed between the mainnet and the secondary networks over the past week, with Ethereum being the network with the highest net inflows compared to other networks, while Polygon PoS and Starknet had lower inflows. In contrast, networks that used to be dominant in speculative activity, such as Base., Arbitrum, BNB Chain, and Hyperliquid all face continued net outflows throughout the same period.
The inflow of funds into the Ethereum network coincided with the market recognizing the continued strong Ethereum Spot ETF outflows, with data indicating that Ethereum ETFs had several consecutive days of outflows in mid-December, reflecting the risk mitigation of institutional investors through traditional market investment products, however, that funds continued to flow directly into the Ethereum network. Indicates that some investors are opting to swing liquidity back to on-chain applications such as DeFi and staking instead of holding via ETFs.
At the same time, fluctuations in the price of digital assets remain a key factor in determining the direction of funding, with the ETH/BTC ratio weakening significantly over the same period, resulting in a decrease in the role of speculation in secondary networks and platforms that rely on short-term liquidity. Funds are therefore allocated back to networks with strong infrastructure. and deeper liquidity, which is consistent with the outflow of money from multiple Layer 2 networks and speculative DeFi platforms.
Crypto market conditions at the end of the year also faced pressure from external factors, such as seasonal liquidity slowdowns and monetary policy uncertainty. As a result, investors tend to manage their portfolios more cautiously, focusing on risk control rather than increasing the investment weight in highly volatile assets.
In conclusion, the flow of money on the blockchain in recent times does not reflect the contraction of the crypto market as a whole, but clearly reflects the state of “risk selection”. Funds continue to circulate in the system, but are concentrated on the main networks like Ethereum and the associated ecosystem, while the platform, which is powered by storage activities. Profits continue to face outflows, with the direction of the market in the next phase remaining stable, depending on the clarity of macroeconomic factors and the level of investor confidence being important.
Fear & Greed Index
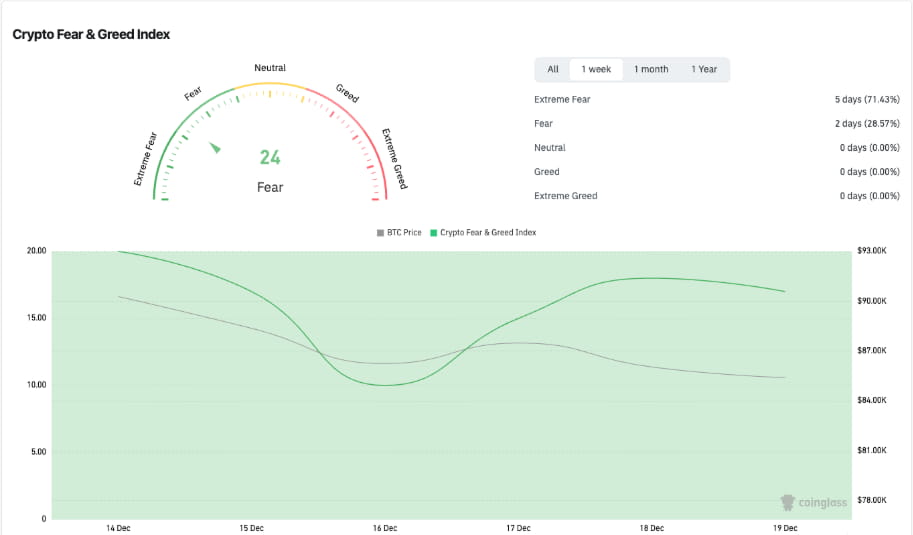
The Crypto Fear & Greed Index is one of the tools used to assess the outlook and sentiment of the crypto market, referring to scores ranging from 0 to 100 (0 stands for Extreme Fear or Extreme Fear and 100 stands for Extreme Greed).
The Crypto Fear & Greed Index as of December 22 is in the Fear zone, with a score of around 24, reflecting the overall picture of the market that is still in high caution. The movement of the index indicates that most investors are not yet confident in the price direction, and the market has not yet clearly returned to the Neutral or Greed zone.
During December 15—16, the index fell significantly, approaching the lows of the same period, which corresponded to the weakening of the Bitcoin price as it appeared on the price chart. The condition reflected the increased selling force and the level of market concern. Investors were likely to slow down their decisions and wait for a more appropriate pace, while in the middle of the week between the 17th. —December 18. The index began a slight recovery, reflecting a technical buying force or price adjustment, and as volatility began to subside, the price moved slightly higher.
However, the positive momentum generated in the middle of the week was not enough to push the index out of the Fear zone sustainably. The short-term rise of the index reflected the appearance of a break in the base rather than entering a clear uptrend, with on December 19th the index again weakened slightly, reinforcing the uncertainty that remained. It covers the market and indicates that investors are still choosing a cautious strategy based primarily on the price rhythm.
Bitcoin ETF Flow
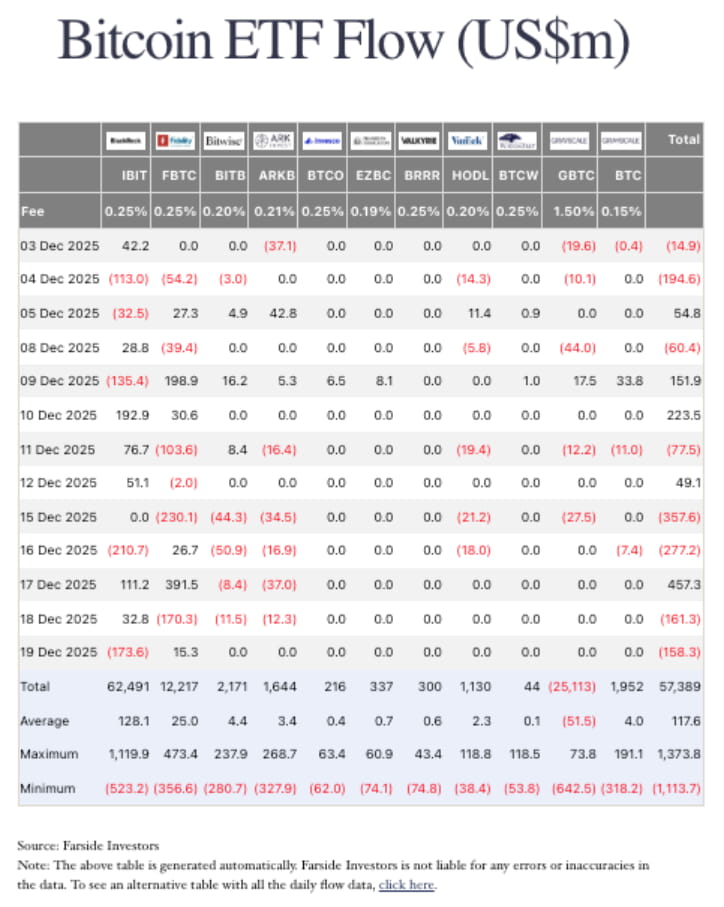
The flow of funds in the Bitcoin ETF between December 15—19 reflects a market that still lacks clear direction. At the beginning of the week of December 15 and 16, relatively high levels of capital outflows, totaling hundreds of millions of US dollars, reflected the risk-reducing behavior of institutional investors after the price adjustment. It came up earlier amid uncertainty from macroeconomic factors and an unclear monetary policy outlook.
On December 17, capital flows began to flow significantly back into the Bitcoin ETF, indicating purchases in a short-term adjusted pace. However, the buying force could not maintain continuity. On December 18 and 19, the flow returned sideways again, reflecting that most investors were still opting for short-term portfolio management and not yet. Ready to increase the holding weight in the long term
In conclusion, the period reflects market conditions that are in a state of waiting for new guiding factors. Volatility and rapid change in the direction of cash flows suggest that Bitcoin ETFs at this stage are also used as a risk management tool rather than long-term asset accumulation, with the next direction remaining dependent on the development of macroeconomic factors, interest policies and confidence levels. Investor confidence
Ethereum ETF Flow
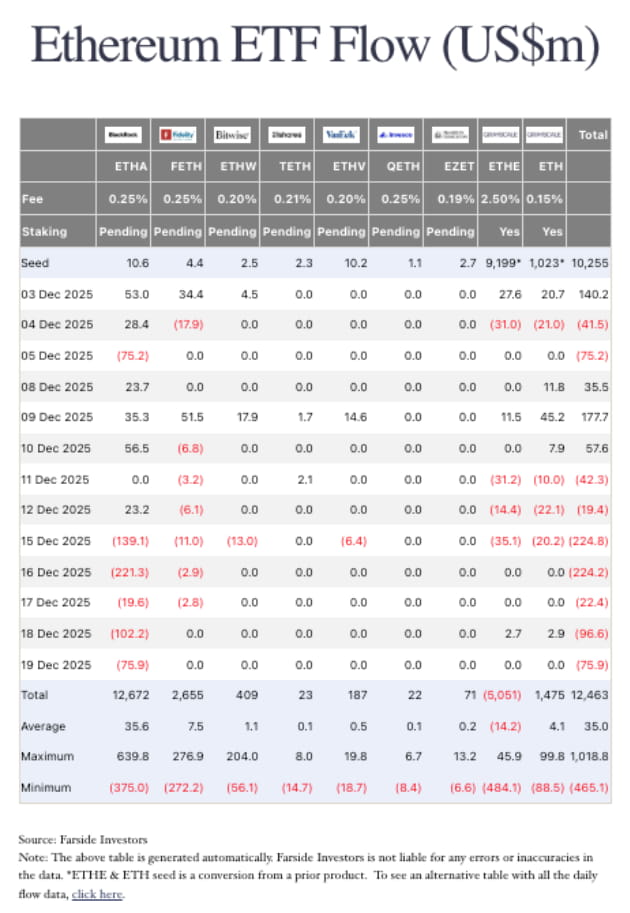
The cash flow in the Ethereum ETF between December 15—19 reflected the ongoing sell-side pressure. December 15 was the day with the highest net cash flow of the period, at around US$224.8 million, reflecting a clear reduction in the risk position of institutional investors within a single day, while December 16. Still, cash outflows were seen at a similar level, at around -224.2 million US dollars. Despite a slight decrease from the previous day, the overall picture remains in the same direction.
After a strong sell-off early in the week, outflows began to slow down on December 17 and 18, before continuing to remain negative on December 19, reflecting that confidence in the Ethereum ETF has not returned. Although the sell-off has eased compared to the early days, there have been no signs of clear or significant inflows.
In summary, the period of December 15—19 is considered to be the period when the Ethereum ETF faces a structural sell-off rather than a short-term base rest. The heavy outflows since the 15th and several consecutive days reinforce the cautious stance of institutional investors towards Ethereum, both in the dimension of returns, staking mechanisms within ETFs, as well as macroeconomic factors. Overall, as a result, the short-term direction remains under pressure until new supporting factors enter the market.
Important news:
Source:
https://crypto.news/ethereum-etfs-extend-7-day-outflow-streak-eth-stalls/?utm
Note: This analysis is provided every Monday, so some articles may have data discrepancies.
Nota: Questo analisi è situato ogni monday, quindi alcuni parti del articolo possono contengono informazioni inaccurati
WARNING: CRYPTOCURRENCIES AND DIGITAL TOKENS ARE HIGHLY RISKY. YOU MAY LOSE YOUR ENTIRE INVESTMENT. PLEASE STUDY AND INVEST ACCORDING TO THE ACCEPTABLE LEVEL OF RISK.
Thank you for following.
J.P. Daniel
News Cryptocurrency
_progressive.jpg)
_progressive.jpg)
_progressive.jpg)
Download the application Maxbit is available at
Securely register with a digital asset trading platform regulated by Thailand’s SEC.


Maxbit Digital Asset Co., Ltd., 90 CW Tower, 31st Floor, Room A3101-02, Ratchadaphisek Road, Huai Khwang Subdistrict, Huai Khwang District, Bangkok 10310, Thailand.
©2025 Maxbit. All Rights Reserved.