
Weekly Recap Research 16 - 22 Feb 2026
Week of February 16 - 22, 2026
_progressive.jpg)
Weekly Recap Research
The word “Bitcoin to Zero” surges in the US, echoing market fears, but the sign of a low point remains unclear.

According to Google Trends, searches for “bitcoin to zero” in the U.S. rose to 100, the February high of the index of interest, in line with a period when the price of Bitcoin plunged closer to the $60,000 level, after falling more than 50% from its peak in October. Some analysts point out that the rise in negative keywords this characteristic often occurs during the market's approach. Capitulation and, in some cases, may be seen as a contrarian signal towards recovery. However, the picture of this situation has not yet appeared as clear as the previous round.
A key factor that also requires caution in interpretation is that the global data does not reflect the same level of panic, with global interest for the same keyword dropping from its peak in August to around 38 currently. Such disparities suggest that concerns may be concentrated in the US rather than global spread, as Google Trends is traditional. Relative sentiment does not directly reflect the number of actual searches, so even if the atmosphere of fear is high, it is still not enough to conclude that the market has clearly passed the low point.
Bitcoin Opens 2026 Worst on Record, After Dropping Over 23% in First 50 Days

Bitcoin faced heavy pressure in early 2026, with data from Checkonchain indicating that the price fell by about 23% within the first 50 days of the year, marking the weakest opening of the year on record. The adjustment led the market to question the continuation of the upward momentum in the previous period, with the selling force continuing since January and extending into February. Amid tight liquidity and institutional investor caution.
Analysts estimate that this picture reflects the nature of the transition in the market cycle, rather than structural weakness. Despite the depressed level of returns at the beginning of the year, Bitcoin has already faced a drawdown in a similar way in previous rounds. However, a sharp decline since the beginning of the year has resulted in the investment climate going into cautious mode. Be careful, and the direction in the next phase depends on the flow of funds from the institution, the global liquidity situation and the level of investor confidence in the next phase.
Top Net flows

The cryptocurrency market faces significant losses amid increasing volatility, with Net Flows data from Artemis reflecting different capital movements across the Ethereum (ETH) network, characterized by the highest net inflows, ranging from around $200—300 million on the chart scale, followed by Polygon PoS, Hyperliquid, WorldChain. And Solana, which has a positive but smaller net inflow balance, while Arbitrum has a maximum net outflow balance near the -$300 million level, reflects the post-unlock pressure of about 92.65 million ARB tokens worth 10—11 million dollars, or about 1.82% of the Circulating supply on February 16, where such an increase in supply has spurred a sell-off in a market that is clearly in some fragility.
The situation is in line with the market outlook remaining at Extreme Fear, with the Fear & Greed Index near level 6, reflecting a broader climate of concern. Bitcoin fell from the week's opening level of $69,000—70,000, to a low of $65,800 before closing near $67,000—68,000, while Ethereum remained low. The drop was below $2,000, with some movements in the $1,900—$2,000 range, as ETF outflows totaled more than $415 million in the week, divided into Bitcoin ETFs with outflows of $300—480 million and Ethereum ETFs around $123—126 million within 7 days, though. Ethereum will signal positive on-chain flows from activity across bridges and movements in the ecosystem, but pressures from macroeconomic uncertainty, token unlocking, and institutional investor portfolio turnover continue to result in the overall market in a state of continued capitulation, while Solana and some other networks can still attract a small amount of inflows. Reflects capital turnover within the digital asset sector amid still high levels of risk
Fear & Greed Index

The Crypto Fear & Greed Index is one of the tools used to assess the outlook and sentiment of the crypto market, referring to scores ranging from 0 to 100 (0 stands for Extreme Fear or Extreme Fear and 100 stands for Extreme Greed).
During February 16—22, 2026, the cryptocurrency market faced a heavy sell-off, with Bitcoin (BTC) opening the week at $68,800—$69,000 on February 16, before rising to the top of the range of around $70,000—70,900 and then continuing to weaken amid a decidedly weak investment climate. The Crypto Fear & Greed Index fell to Extreme Fear at 6, reflecting the panic and surrender of investors in the market, while BTC closed on February 22 at $67,600—$68,000, down about 2— 3% from the beginning of the week and counting as a continuation of the correction due to the level. Above $70,000 at the beginning of the week
The move is in line with a number of external factors, including macroeconomic concerns, particularly trade and tax policy uncertainty putting pressure on risky assets, the massive unlocking of tokens from several projects such as Arbitrum and others totaling over $100 million, as well as significant cash flows from crypto ETF funds. These factors have resulted in the market being in a state of Extreme Fear throughout the week. Despite the retrospective view that such conditions could open the way to a recovery if sentiment returns, in the short term the market continues to face pressure.
Bitcoin ETF Flow
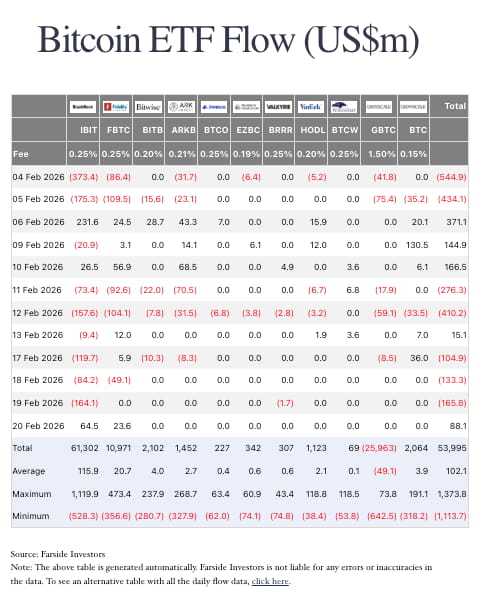
Spot Bitcoin ETF Flow reversed direction from outflows at the beginning of the week to a clear positive towards the end of the week, with net outflows of $104.9 million on February 17, outflows of -$133.3 million on February 18, and the heaviest on February 19 at -$165.8 million. A total of three negative days amounted to -404.0 million dollars, however. On February 20, cash flows reversed to a net inflow of +$88.1 million, helping to halt the outflow in the short term, with the day's positive side bullion concentrated at IBIT +$64.5 million and FBTC +$23.6 million, while most other funds moved close. Zero or Equilibrium
Taking a structural look at the buying and selling forces during this period, it can be seen that key variables remain at IBIT and FBTC, both sources of outflows on certain days, such as February 19, with IBIT outflows of -$164.1 million and the main support in the rebound rhythm on February 20, while GBTC during the same period also has periodic outflows such as February 17. At -$8.5 million and on February 18, moving close to zero, the overall picture reflects that although the end of the week begins to see funds back into the system, the characteristics of the movement are more of a shift of money between funds rather than a return to a full uptrend. The layout of the whole market
Ethereum ETF Flow

The cash flow in the Ethereum ETF reflects a continued picture of “net inflows”, despite some days being in a steady state. On February 17, there was net inflows of around $48.6 million, led by ETHA with inflows of $22.9 million and Grayscale ETH at $11.3 million, while on February 20, the overall picture was at $0 million, with strength. INFLOWS OF $1.8 MILLION IN ETHA AND $0.7 MILLION IN TETH WERE OFFSET BY CASH OUTFLOWS FROM FETH OF AROUND $2.5 MILLION. LOOKING AT THE OVERVIEW THROUGHOUT FEBRUARY, ACCUMULATED NET INFLOWS OF $705.6 MILLION WERE FOUND, REFLECTING THE LEVEL OF INSTITUTIONAL INVESTOR CONFIDENCE IN ETH THAT INCREASED AS IT MATCHED. WITH THE START OF THE YEAR, WITH MAJOR PILES LIKE ETHA AND FETH ACTING AS KEY DRIVERS.
Such inflows contributed to the ETF's total net asset value rising to a high level amid ETH price movements in a positive frame. Despite some days of sell-off from some funds such as FETH on February 20, the overall picture also reflects the nature of “positive coin turnover” between the various funds compared to Bitcoin. ETFs that are also facing outflows over similar periods of time. The direction of Ethereum ETFs is therefore clearly differentiated in the flow of capital.
Important news:
Hanwha joins hands with Jito to explore ETP products on JitoSol in South Korea
TradFi Giant BlackRock Begins Acquisition of DeFi Tokens, Bolstering TradFi—DeFi Convergence
AI Agent tricks OpenAI developers into handing over entire memecoin ports to users on X
Source:
https://tokenomist.ai/arbitrum/unlock-events
https://www.theblock.co/data/on-chain-metrics/ethereum
Note: This analysis is provided every Monday, so some articles may have data discrepancies.
Nota: Questo analisi è situato ogni monday, quindi alcuni parti del articolo possono contengono informazioni inaccurati
WARNING: CRYPTOCURRENCIES AND DIGITAL TOKENS ARE HIGHLY RISKY. YOU MAY LOSE YOUR ENTIRE INVESTMENT. PLEASE STUDY AND INVEST ACCORDING TO THE ACCEPTABLE LEVEL OF RISK.
Thank you for following.
J.P. Daniel
News Cryptocurrency
%2016.26.22_progressive.jpg)
_progressive.jpg)
%20(1)_progressive.jpg)
Download the application Maxbit is available at
Securely register with a digital asset trading platform regulated by Thailand’s SEC.


Maxbit Digital Asset Co., Ltd., 90 CW Tower, 31st Floor, Room A3101-02, Ratchadaphisek Road, Huai Khwang Subdistrict, Huai Khwang District, Bangkok 10310, Thailand.
©2025 Maxbit. All Rights Reserved.